Free application to monitor COVID-19 around the world in real time
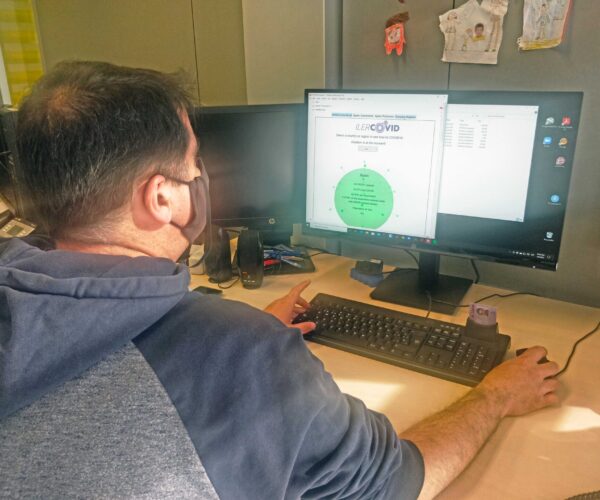
Researchers at the University of Lleida (UdL) and the Biomedical Research Institute of Lleida (IRBLleida) have developed a free application to monitor the SARS-CoV-2 pandemic. Created as part of the UdL’s IlerCOVID research project, COVIDWORLD allows the current situation of the virus in 238 Spanish countries and regions to be graphically visualised, along with its progression from January 2020 to the present, facilitating the comparison of cases. This tool, created with the aim of bringing pandemic data analysis closer to the public, is available for download on the Wolfram Community platform.
COVIDWORLD compiles real-time data from the World Health Organisation and the Escovid19data project on the pandemic situation. The information is analysed and transformed into 9 variables: daily COVID-19 infections, total infected persons, persons fully vaccinated, persons recovered from the disease, reported deaths, vaccinations carried out, population susceptible to infection, virus replication rate and resurgence rate. The user can select to see graphically how the pandemic situation has progressed with respect to a given variable. In addition to consulting data, COVIDWORLD allows comparisons of the current COVID-19 situation between continents, countries, autonomous communities or Spanish provinces.
“Our idea was to design a simple, intuitive application available to all citizens to disseminate the importance of data representation and analysis technology in decision-making,” explains Rui Alves, lecturer at the UdL and researcher in the Systems Biology and Statistical Methods for Health Research group at the IRBLleida. Thus, although COVIDWORLD is applied to COVID-19 to observe the waves of the virus and allow the user to evaluate the effectiveness of the control measures adopted in each area, the app can also be adapted for data from other countries and regions.
The application, which runs on the Wolfram Mathematica software system, is used in four panels. The first panel shows up-to-date data on the progression of the pandemic worldwide. The second and third panels show, respectively, the situation according to the autonomous community or Spanish province consulted. Finally, the fourth panel provides a comparison of the different variables between two regions of choice. The results are presented both as a silhouette of the COVID-19 virus, which changes colour according to the percentage of vulnerability of the population to the disease, and as a graph showing the curve of cases from January 2020 to the present in the chosen region.
This tool has been developed with funding from the Generalitat de Catalunya through the IlerCOVID project of the UdL (2020PANDE00124) and the FIS project PI20/00377 of the Instituto de Salud Carlos III. Researchers at the University of Lleida and the IRBLleida are already working on the development of an application to model different epidemics and analyse their impact through three specific epidemiological models.
Text: Comunicació Agrotecnio/ Premsa UdL
MORE INFORMATION: Disemination article and download COVIDWORLD app: current data and visualizations for SARS-CoV2 pandemic


